

- Sie haben noch keine Artikel in Ihrem Warenkorb.
Outcomes of SARS-CoV-2 and Seasonal Viruses Among Children Hospitalized in Brazil (Nachrichten)
BACKGROUND AND OBJECTIVES:
Understanding how severe acute respiratory syndrome coronavirus 2 (SARS-CoV-2) interacts with other respiratory viruses is crucial for developing effective public health strategies in the postpandemic era. This study aimed to compare the outcomes of SARS-CoV-2 and seasonal viruses in children and adolescents hospitalized with severe acute respiratory infection (SARI).
METHODS:
This population-based, retrospective cohort study included children and adolescents hospitalized with SARI from February 2020 to February 2023 in Brazil. The main exposure of interest was viral etiology. The primary outcome was in-hospital mortality. Competing risk analysis was used to account for time dependency and competing events.
RESULTS:
A total of 235 829 patients had available results of the viral tests, with SARS-CoV-2 predominance. According to the competing-risk survival analysis, the estimated probability of a fatal outcome at 30 days of hospitalization according to the viral strain was 6.5%, 3.4%, 2.9%, 2.3%, 2.1%, and 1.8%, for SARS-CoV-2, coinfection, adenovirus, influenza, other viruses, and respiratory syncytial virus, respectively. Individuals with a positive test for SARS-CoV-2 had hazard of death 3 times higher than subjects with a negative test (hazard ratio, 3.3; 95% confidence interval, 3.1–3.5). After adjustment by the competing-risk multivariable analysis, admission in Northeast and North regions, oxygen saturation <95%, and the presence of comorbidities were risk factors for death in all viral strains.
CONCLUSIONS:
SARS-CoV-2 infection had the highest hazard of in-hospital mortality in this pediatric cohort hospitalized with SARI. Regardless of viral etiology, the presence of underlying medical conditions was a risk factor for death.
COVID-19, Influenza, RSV
Topics:brazil, covid-19, influenza, sars-cov-2, severe acute respiratory syndrome, oxygen saturation measurement, respiratory tract infections, adenoviruses, coronavirus, coinfection
What’s Known on This Subject:
The coronavirus disease 2019 pandemic and the implementation of mitigation measures have affected circulation of seasonal respiratory viruses. Little is known about the comparative outcomes of severe acute respiratory syndrome coronavirus 2 and common respiratory viruses in children.
What This Study Adds:
Among children hospitalized with acute respiratory infection, severe acute respiratory syndrome coronavirus 2 infection presented the highest risk of in-hospital mortality compared with seasonal viruses. The presence of underlying medical conditions was a risk factor for death for all viruses.
Acute respiratory infection in children is a significant global health problem, with heterogeneous clinical manifestations and pathogens involved, including respiratory syncytial virus (RSV) and influenza.1 The emergence of severe acute respiratory syndrome coronavirus 2 (SARS-CoV-2) in 2020 has had an evident impact on the epidemiology of acute respiratory infections worldwide, underscoring the importance of data that directly compare the burden of SARS-CoV-2 infection and other viral etiologies.2 Previous studies, mainly in adults, have shown that coronavirus disease 2019 (COVID-19) is associated with a higher risk of death and utilization of health care resources than other viruses.3,4 Understanding how SARS-CoV-2 interacts with other respiratory viruses and how it affects children and adolescents is important in the postpandemic era. In this context, a comprehensive assessment of the outcomes caused by emergent and seasonal viruses is pivotal to setting preventive measures, including vaccination strategies.5
In this retrospective cohort study, we used the Brazilian national epidemiologic surveillance system to compare clinical outcomes of SARS-CoV-2 and seasonal virus infections and risk factors of death among children and adolescents hospitalized with severe acute respiratory infection (SARI).
Methods
Study Design and Participants
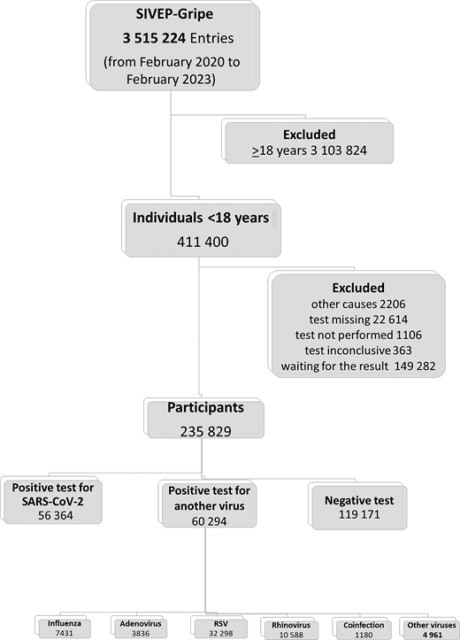
We analyzed all cases hospitalized with SARI recorded in the Influenza Epidemiologic Surveillance Information System (SIVEP-Gripe). SIVEP-Gripe is a nationwide database established by the Ministry of Health to keep surveillance of SARI in Brazil.6 To be registered in the SIVEP-Gripe database, patients must present with a flu-like syndrome and at least 1 of the following criteria: Dyspnea, respiratory distress, oxygen saturation <95% in room air, and cyanosis. For pediatric cases, child-specific symptoms (intercostal retractions, nasal dilation, dehydration, and lack of appetite) are also considered for inclusion in the database. SARI is a notifiable disease in Brazil, and it must be reported to the health authorities within 24 hours of suspicion. The notification is compulsory, and the information is recorded in the SIVEP-Gripe database, which receives data from patients admitted to both public and private hospitals. Upon admission, cases were tested for SARS-CoV-2 and other common seasonal respiratory viral etiologies using reverse transcriptase-polymerase chain reaction or antigen testing. Detailed information regarding the SIVEP-Gripe database, including report form, data dictionary, codes, and all deidentified data, are publicly available at https://opendatasus.saude.gov.br/dataset. Additional information regarding this data set, including the steps of the data retrieving and management, is provided in detail in Supplemental Information 1. The inclusion criterion was pediatric patients (aged <18 years old) registered in the database between February 2020 to February 2023. The information about included and excluded cases is displayed in Fig 1.
FIGURE 1

Covariables and Definitions
SIVEP-Gripe provides clinical and demographic data, including age, sex, ethnicity, country regions, date of symptom onset, date of admission, signs and or symptoms at admission, oxygen saturation, and comorbidities. For analysis, age was categorized into 3 groups (aged <2 years, 2–11 years, and 12–17 years). Additional information regarding data preparation, definitions of covariates, and missing management are detailed in Supplemental Information 2.
Exposure of Interest
The primary exposure of interest was the virus strain identified by the laboratory tests at admission.
Outcomes
The primary outcome was in-hospital mortality. The clinical course was reported regarding respiratory support (none, noninvasive oxygen support, and invasive ventilation), admission to the ICU, and death.
Statistical Analysis
The analysis was conducted in 3 consecutive stages. First, we used summary statistics to describe the clinical and demographic characteristics of the population included in the analysis. For this stage, descriptive data are presented as means (and SDs), medians (and interquartile ranges), counts, and proportions. We used the F test and the χ2 test for comparisons between groups when appropriate. In the second step, we evaluated the effect of viral etiology on the survival of children and adolescents with SARI. For this step, we carried out a competing-risk survival analysis, using the cumulative incidence function (CIF)7 and the Fine-Gray model8 to estimate the cumulative incidence of the primary outcome over time. In this analysis, in-hospital mortality was the primary outcome, and hospital discharge was considered a competing event. Finally, we conducted a multivariable competing-risk survival analysis for each viral strain to identify independent risk factors of death. All models were adjusted by sex, ethnicity, year of admission, region of hospitalization, oxygen saturation at admission, and comorbidities. The results are expressed as adjusted hazard ratios (HRs) and 95% confidence intervals (CIs). All statistical tests were 2-tailed, and statistical significance was set at P < .05. The study followed the Strengthening the Reporting of Observational Studies in Epidemiology reporting guideline for cohort studies.
Ethical Aspects
We accessed data in SIVEP-Gripe, which are already deidentified and publicly available. The study was approved by the Federal University of Minas Gerais institutional review board (Research Ethics Committee, reference number 6.127.414).
Results
Participants
Between February 16, 2020, and February 21, 2023, 3 515 224 cases of SARI were reported in the SIVEP-Gripe. Among them, 411 400 patients (11.7%) were <18 years of age at admission. A total of 175 707 cases were excluded. Therefore, the final sample consisted of 235 829 hospitalized pediatric patients (Fig 1). We performed a sensitivity analysis for those cases without information on viral etiology tests (described in detail in Supplemental Information 3).
The demographic and clinical characteristics of the 235 829 pediatric patients hospitalized with SARI according to viral etiology are shown in Table 1. The overall mean age at admission was 3.8 years (SD 4.5). Regarding viral etiology, there was a higher proportion of positive cases for SARS-CoV-2 in adolescents, whereas RSV cases predominate in infants. Regarding clinical outcomes, 54 962 (25.6%) patients were admitted to the ICU, 105 401 (50.63%) required noninvasive oxygen support, 18 472 (8.9%) required invasive ventilation and 7078 (3.0%) individuals had a fatal outcome. Interestingly, although RSV positive cases had proportionally lower oxygen saturation at entry and required more ICU admission and oxygen support, the in-hospital mortality rate was higher for SARS-CoV-2 positive cases (Table 1).
TABLE 1
Demographic Features, Clinical Characteristics, and Outcomes of Children and Adolescents According to the Laboratory-Confirmed Viral Etiology
| Overall (%) | Test Negative | SARS-CoV-2 | RSV (%) | Rhinovirus (%) | Influenza (%) | Adenovirus (%) | Coinfection (%)a | Other Viruses (%)b | P | |
|---|---|---|---|---|---|---|---|---|---|---|
| 235 829 (100) | 119 171 (31.0) | 56 364 (14.6) | 32 298 (8.4) | 10 588 (2.7) | 7431 (1.9) | 3836 (1.0) | 1180 (0.3) | 4961 (1.3) | ||
| Age (y) | ||||||||||
| Median (IQR) | 1.9 (0.5–5.4) | 2.4 (0.7–5.7) | 2.8 (0.6–9.3) | 0.4 (0.2–1.2) | 2.4 (0.8–5.2) | 4.0 (1.3–8.6) | 1.8 (0.9–3.3) | 0.6 (0.3–2.0) | 1.3 (0.5–2.8) | <.001 |
| Mean (SD) | 3.8 (4.5) | 3.9 (4.2) | 5.3 (5.7) | 1.0 (1.7) | 3.5 (3.5) | 5.4 (4.8) | 2.6 (2.5) | 2.0 (3.4) | 2.2 (2.8) | <.001 |
| Age group (y) | ||||||||||
| <2 | 118 698 (50.3) | 53 430 (44.8) | 24 715 (43.8) | 27 351 (84.7) | 4677 (44.2) | 2468 (33.2) | 2041 (53.2) | 874 (74.1) | 3142 (63.3) | <.001 |
| 2–11 | 96 955 (41.1) | 57 551 (48.3) | 21 314 (37.8) | 4805 (14.9) | 5549 (52.4) | 4013 (54.0) | 1746 (45.5) | 262 (22.2) | 1715 (34.6) | |
| 12–17 | 20 176 (8.6) | 8190 (6.9) | 10 335 (18.3) | 142 (0.4) | 362 (3.4) | 950 (12.8) | 49 (1.3) | 44 (3.7) | 104 (2.1) | |
| Gender (n = 235 729) | ||||||||||
| Female | 106 486 (45.2) | 53 876 (45.2) | 25 837 (45.9) | 14 493 (44.9) | 4551 (43.0) | 3279 (44.1) | 1623 (42.3) | 516 (43.7) | 2311 (46.6) | <.001 |
| Male | 129 243 (54.8) | 65 242 (54.8) | 30 493 (54.1) | 17 798 (55.1) | 6032 (57.0) | 4 151 (55.9) | 2213 (57.7) | 664 (56.3) | 2650 (53.4) | |
| Admission y | ||||||||||
| 2020 | 46 768 (19.8) | 28 010 (23.5) | 14 768 (26.2) | 1255 (3.9) | 1198 (11.3) | 798 (10.7) | 260 (6.8) | 54 (4.6) | 425 (8.6) | <.001 |
| 2021 | 77 905 (33.0) | 37 991 (31.9) | 19 537 (34.7) | 12 686 (39.3) | 3047 (28.8) | 2279 (30.7) | 533 (13.9) | 330 (28.0) | 1 502 (30.3) | |
| 2022 | 104 975 (44.5) | 50 106 (42.0) | 21 132 (37.5) | 16 882 (52.3) | 6015 (56.8) | 4191 (56.4) | 2965 (77.3) | 759 (64.3) | 2925 (59.0) | |
| 2023 | 6181 (2.6) | 3046 (2.6) | 927 (1.6) | 1475 (4.6) | 328 (3.1) | 163 (2.2) | 78 (2.0) | 37 (3.1) | 109 (2.2) | |
| Region | ||||||||||
| Southeast | 115 185 (48.8) | 65 809 (55.2) | 23 945 (42.5) | 16 379 (50.7) | 1178 (16.8) | 3663 (49.3) | 1034 (27.0) | 613 (51.9) | 1964 (39.6) | <.001 |
| South | 45 972 (19.5) | 20 305 (17.0) | 7529 (13.4) | 8779 (27.2) | 4657 (44.0) | 1192 (16.0) | 1785 (46.5) | 257 (21.8) | 1468 (29.6) | |
| Central-West | 22 581 (9.6) | 8741 (7.3) | 5638 (10.0) | 3736 (11.6) | 2180 (20.6) | 821 (11.0) | 501 (13.1) | 126 (10.7) | 838 (16.9) | |
| Northeast | 38 492 (16.3) | 19 497 (16.4) | 12 464 (22.1) | 2622 (8.1) | 1631 (15.4) | 1513 (20.4) | 253 (6.6) | 154 (13.1) | 358 (7.2) | |
| North | 13 599 (5.8) | 4819 (4.0) | 6788 (12.0) | 782 (2.4) | 342 (3.2) | 242 (3.3) | 263 (6.9) | 30 (2.5) | 333 (6.7) | |
| Ethnicity (n = 188 105) | ||||||||||
| White | 88 409 (47.0) | 43 998 (46.3) | 18 808 (41.2) | 14 230 (56.4) | 4276 (51.3) | 2928 (49.0) | 1728 (56.5) | 481 (51.4) | 1960 (50.4) | <.001 |
| Brown | 90 597 (48.2) | 46 300 (48.7) | 24 389 (53.5) | 9939 (39.4) | 3790 (45.4) | 2757 (46.2) | 1233 (40.3) | 408 (43.6) | 1781 (45.8) | |
| Black | 6665 (3.5) | 3721 (3.9) | 1517 (3.3) | 815 (3.2) | 183 (2.2) | 211 (3.5) | 67 (2.2) | 37 (4.0) | 114 (2.9) | |
| Asian American | 1152 (0.6) | 583 (0.6) | 336 (0.7) | 124 (0.5) | 43 (0.5) | 31 (0.5) | 8 (0.3) | 7 (0.7) | 20 (0.5) | |
| Indigenous | 1282 (0.7) | 497 (0.5) | 546 (1.2) | 106 (0.4) | 50 (0.6) | 44 (0.7) | 25 (0.8) | 2 (0.2) | 12 (0.3) | |
| Signs and symptoms at baseline | ||||||||||
| Fever | 154 063 (65.3) | 74 962 (62.9) | 38 269 (67.9) | 20 846 (64.5) | 6252 (59.0) | 6120 (82.4) | 3118 (81.3) | 852 (72.2) | 3644 (73.5) | <.001 |
| Cough | 179 352 (76.1) | 91 010 (76.4) | 36 324 (64.4) | 28 910 (89.5) | 8685 (82.0) | 6003 (80.8) | 3160 (82.4) | 1014 (85.9) | 4246 (85.6) | <.001 |
| Respiratory distress | 132 905 (56.4) | 69 135 (58.0) | 25 252 (44.8) | 22 305 (69.1) | 6693 (63.2) | 3529 (47.5) | 2085 (54.4) | 752 (63.7) | 3154 (63.6) | <.001 |
| Dyspnea | 132 783 (56.3) | 69 949 (58.7) | 26 381 (46.8) | 20 874 (64.6) | 6611 (62.4) | 3294 (44.3) | 1931 (50.3) | 701 (59.4) | 3042 (61.3) | <.001 |
| Oxygen saturation <95% (n = 194 863) | 112 218 (57.6) | 59 525 (57.7) | 20 343 (48.2) | 18 917 (69.1) | 5624 (65.6) | 2806 (48.9) | 1703 (56.6) | 641 (65.0) | 2659 (70.0) | <.001 |
| Odynophagia | 25 218 (10.7) | 12 623 (10.6) | 8004 (14.2) | 1453 (4.5) | 973 (9.2) | 1267 (17.1) | 432 (11.3) | 79 (6.7) | 387 (7.8) | <.001 |
| Diarrhea | 23 995 (10.2) | 11 892 (10.0) | 7259 (12.9) | 2455 (7.6) | 724 (6.8) | 655 (8.8) | 479 (12.5) | 118 (10.0) | 413 (8.3) | <.001 |
| Vomit | 38 716 (16.4) | 20 479 (17.2) | 9671 (17.2) | 4161 (12.9) | 1491 (14.1) | 1337 (18.0) | 702 (18.3) | 187 (15.8) | 688 (13.9) | <.001 |
| Abdominal pain | 13 582 (5.8) | 7364 (6.2) | 4139 (7.3) | 650 (2.0) | 557 (5.3) | 455 (6.1) | 205 (5.3) | 37 (3.1) | 175 (3.5) | <.001 |
| Number of comorbidities | ||||||||||
| None | 203 544 (86.3) | 102 395 (85.9) | 46 345 (82.2) | 30 389 (94.1) | 9217 (87.1) | 6429 (86.5) | 3409 (88.9) | 1064 (90.2) | 4296 (86.6) | <.001 |
| 1 | 26 468 (11.2) | 13 843 (11.6) | 8006 (14.2) | 1584 (4.9) | 1167 (11.0) | 862 (11.6) | 359 (9.4) | 91 (7.7) | 556 (11.2) | |
| 2 | 4842 (2.1) | 2440 (2.0) | 1649 (2.9) | 288 (0.9) | 162 (1.5) | 124 (1.7) | 58 (1.5) | 23 (1.9) | 98 (2.0) | |
| ≥3 | 975 (0.4) | 493 (0.4) | 364 (0.6) | 37 (0.1) | 42 (0.4) | 16 (0.2) | 10 (0.3) | 2 (0.2) | 11 (0.2) | |
| ICU admission (n = 215 060) | ||||||||||
| No | 160 098 (74.4) | 83 987 (76.8) | 35 512 (72.2) | 21 165 (69.2) | 7431 (74.3) | 4886 (75.8) | 2852 (78.0) | 718 (64.0) | 3547 (75.0) | <.001 |
| Yes | 54 962 (25.6) | 25 357 (23.2) | 13 642 (27.8) | 9438 (30.8) | 2575 (25.7) | 1562 (24.2) | 805 (22.0) | 403 (36.0) | 1180 (25.0) | |
| Oxygen support (n = 208 239) | ||||||||||
| None | 84 366 (40.5) | 42 041 (40.1) | 24 528 (50.7) | 7709 (25.8) | 3306 (34.3) | 3110 (49.5) | 1637 (46.6) | 338 (31.3) | 1697 (37.1) | |
| Noninvasive | 105 401 (50.6) | 54 081 (51.5) | 18 889 (39.1) | 19 439 (65.1) | 5626 (58.3) | 2701 (43.0) | 1581 (45.0) | 614 (56.9) | 2 470 (54.1) | <.001 |
| Invasive | 18 472 (8.9) | 8794 (8.4) | 4943 (10.2) | 2734 (9.1) | 712 (74) | 468 (7.5) | 293 (8.3) | 127 (11.8) | 401 (8.8) | |
| In-hospital mortality rate (n = 234 337) | ||||||||||
| No | 227 259 (97.0) | 115 729 (97.7) | 52 379 (93.9) | 31 847 (98.8) | 10 366 (98.2) | 7232 (97.8) | 3716 (97.1) | 1138 (96.9) | 4852 (97.9) | |
| Yes | 7078 (3.0) | 2726 (2.3) | 3377 (6.1) | 371 (1.2) | 193 (1.8) | 161 (2.2) | 110 (2.9) | 37 (3.1) | 103 (2.1) | <.001 |
Epidemic Curve
Figure 2 shows the cases hospitalized with SARI over time in patients <18 years of age with laboratory-confirmed viral etiology, stratified by age group and year of hospitalization. The first laboratory-confirmed SARS-CoV-2 infection was reported in Brazil on February 16, 2020. Figure 2 shows that SARS-CoV-2 infection became prevalent in all age groups around the 14th epidemiologic week of 2020 and maintained a prevalence >80% throughout 2020. During the second year of the pandemic, SARS-CoV-2 infection was still prevalent in children, but RSV became dominant in infants around the 10th epidemiologic week. During the third year of the pandemic, with the emergence of the omicron variant, SARS-CoV-2 infection became predominant again, regardless of age, until around the ninth epidemiologic week, when RSV returned to predominate in infants (Fig 2).
FIGURE 2
Incident cases of SARI in children and adolescents according to the viral etiology, age, and year of admission during the 3 years of the COVID-19 pandemic in Brazil.
Risk Factors of Fatal Outcome
According to the competing-risk survival analysis, the overall estimated probability of death of the entire cohort was 3.2%. Figure 3 illustrates the CIF according to viral etiology. The estimated probability of a fatal outcome at 30 days of hospitalization according to the viral strain was 6.5%, 3.4%, 2.9%, 2.3%, 2.1%, and 1.8%, for SARS-CoV-2, coinfection, adenovirus, influenza, other viruses, and RSV, respectively. For those cases with a negative test at admission, the probability of death was estimated as 2.4% (Fig 3).
FIGURE 3

In the competing-risk univariate analysis, children with a positive test for SARS-CoV-2 had a hazard of death 3 times higher compared with individuals with a negative test (HR, 3.3; 95% CI, 3.1–3.5). Cases with coinfection (HR, 1.7; 95% CI, 1.2–2.4) and a positive test for adenovirus (HR, 1.4; 95% CI, 1.2–1.7) also had a significantly increased death hazard compared with the reference category. On the other hand, cases with a positive test for RSV (HR, 0.57; 95% CI, 0.51–0.65) and rhinovirus (HR, 0.79; 95% CI, 0.69–0.94) had a relatively reduced hazard of death during hospital stay (Fig 4).
FIGURE 4

Figure 5 shows the multivariable competing risk analysis models of death risk factors for each of the main viral strains (Fig 5A–D). For RSV-positive cases, the following covariates were associated with fatal outcome, age (12–17 years), Indigenous ethnicity, admission in Northeast or North regions, oxygen saturation <95% at admission, and presence of comorbidities (Fig 5A). For influenza-positive cases, age (12–17 years), admission in Northeast or North regions, oxygen saturation <95%, and presence of comorbidities (Fig 5B). For adenovirus cases, covariates associated with the primary outcome were Indigenous ethnicity, admission in Northeast or North regions, oxygen saturation <95%, and presence of comorbidities (Fig 5C). For SARS-CoV-2–positive cases, age (<2 years and 12–17 years), Indigenous ethnicity, admission in Northeast or North regions, oxygen saturation <95%, and presence of comorbidities were risk factors of death. Of note, admission after 2021 was increasingly protective against death for cases positive for SARS-CoV-2 (Fig 5D).
FIGURE 5


Discussion
In this population-based study conducted over the 3 years of the COVID-19 pandemic in Brazil, we analyzed a nationwide database of hospitalized children and adolescents with SARI and confirmed viral etiology. To our knowledge, this report is the first large-scale study assessing competing risks of death in children and adolescents with SARI associated with SARS-CoV-2 and other seasonal respiratory viruses. After accounting for competing events and confounding factors, patients infected with SARS-CoV-2 had the highest risk of death compared with those with a negative test. Positive tests for adenovirus, influenza, and coinfections were also associated with an increased risk of death. Other risk factors for death included hospitalization in the poorest regions of Brazil, low oxygen saturation at admission, and presence of comorbidities.
Quelle: publications.aap.org
Den ersten Kommentar schreiben.
Antworten
Sie müssen eingeloggt sein, um einen Kommentar zu schreiben.